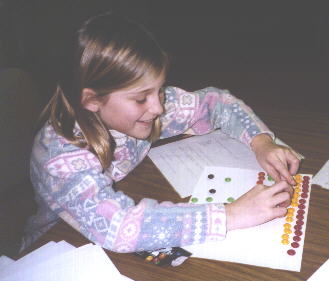
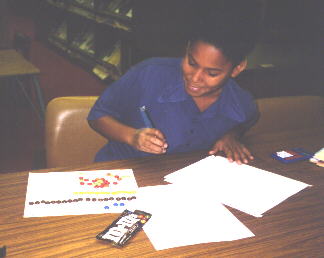
Right before we left for Christmas break, we got out our bags of M & M's. First we estimated what number of M & M's there were total in the bag. Then we estimated how many of each color there were in the bag ( red, yellow, orange, green, brown, and blue). There were no light browns in any of the bags. ( We think that is what they replaced blue with) Then we took the M & M's out of the bag.
Then we counted the actual amount of red, yellow, orange, green, brown, and blue there were in the bag. on a sheet of blank paper we lined our M & M's in rows by their color, from highest amount to lowest amount, in the same way graphing our data.
Then we determined the fractional part of yellows there were in the bag, according to our own bags. Then we looked to see if the total of M & M's were the same in each bag. They were not, but a couple of people did have the same amount. Then we saw what fraction of the whole bag were brown, according to our own bags. After that some people made word problems with their data. Last but not least we ate our data! It was delicious!
Below is a chart of all the people who participated in the M & M project, and their actual amount of each color there was in their bag.
***Ranges and Averages were done by my brother Jarrett T.
Sincerely,
Colors           red   yellow  orange green  brown  blue
Ranges          7-23    4-21    2-8    1-9   13-24   1-8
Average         13.5    12.9    4.7    6.2   15.5    3.1
---------------------------------------------------------
Quinnisha S.     23      4       6     8     16      1
Ashley R.         7     12       8     8     17      2
Megan D.         19     14       2     5     14      1
Amanda T.        15     15       3     1     17      4
Casie C.         15     9        5     8     14.5    3
Ashley W.        10     14       6     6     15      3
Ashley A.        16     15       3     7     13      6
Jarrett T.       13     12       4     8     19      3
Ashleigh D.      16     12       3     5     13      3
Kristen S.       11     19       7     7     13      8
Sarena T.        11     13       7     9     14      3
Kaley M.         16     11       4     9     14      4
Stephanie P.     13     21       5     2     15      3
Ebony P.         12      8       4     8     24      2
Cate L.          10     13       5     4     16      7
Krystle K.       14      8       3     8     21      1
Caitlin R.       14     14       6     8     13      2
Heather B.        9     19       4     1     23      1
Amanda & Jarrett Tillman and
Kristen and Heather helped too
 Go to the KIDLINK Home Page
pweeg@shore.intercom.net
Return to Global Classroom